Like no politician before him, Barack Obama has relied on the Internet as a tool of communication and mobilisation, and the success of his campaigns has led experts to the conclusion that the Internet played a crucial role in the last two presidential elections. An observer of the past campaigns could easily think that the average Internet user is young, liberal, connected and well informed, and therefore more likely to vote for Obama than the average American. But the following analysis of 2’487 job approval polls shows that the average Internet poll approval rating is actually 3.6 percentage points lower than the general average and 4.6 points lower than the average phone poll, and that the bias of the polling mode is consistent across time and pollsters. I show how we can make this bias visible using simple data visualisation techniques, and try to find explanations for the bias in online polling.
My analysis started as an attempt to determine the factors that influence presidential job approval. While the some results are interesting, they can’t be analized statistically. Starting a war or getting attacked by terrorists are good ways to improve your approval, saying „I did not have sexual relations with that woman“ on national television and later admitting to an inappropriate relationship surprisingly has no negative effect. Other results (such as correlation with economic factors) are statistically interpretable, but they are somewhat unsurprising, the topic is well documented in research, and the analysis of the conflicting theories is beyond the scope of this blog post. So, inspired by the work Gregor Aisch has done on polling bias in German parliamentary elections, I decided to focus on how different polls might be biased.
First, let’s look at the data. For measuring the approval of the US President, polls are conducted on a daily basis. For President Obama’s approval alone, almost 2’500 polls have been published, and luckily, the friendly people of the Huffington Post have combined them into a comprehensive dataset. There are also other poll-aggregating websites such as RealClearPolitics.com or the more academic Job Approval Rating web site run by several US universities, but the Huffington Post has the most recent and comprehensive data.
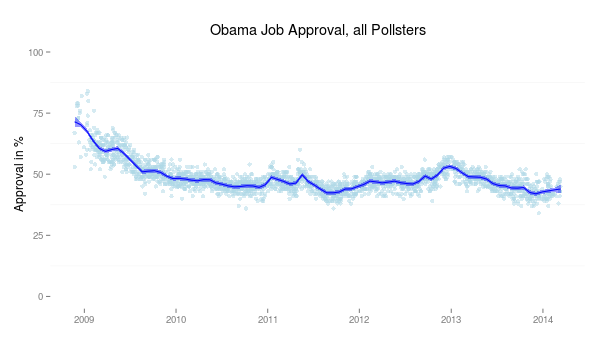
Luckily, the Huffington Post also categorizes polls by pollster and survey method, but seems not to have published any analysis on these variables. This allows us to graphically show how some polling institutes produce systematically biased results. First, below are all the polls of the Huffington Post dataset. Also included is a graphical representation of the conditional mean using a LOESS regression model, and the corresponding standard error.
If you’re a fan of interactivity but hate detailed analysis, the Huffington Post also offers an embeddable chart:
The interpretation of this graph is, apart from the spike caused by the capture and killing of Osama bin Laden in May 2011, a somewhat risky and complex business. With a multitude of factors that could influence the ratings, each deserving its own blog post, I will focus on bias among Pollsters (I recommend reading Nate Silver’s takes on the economy in 2011 and in 2013, and the Washington Posts‘ piece on mixed signals if you’re interested on more factors explaining the current presidential approval.)
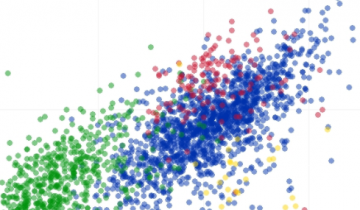
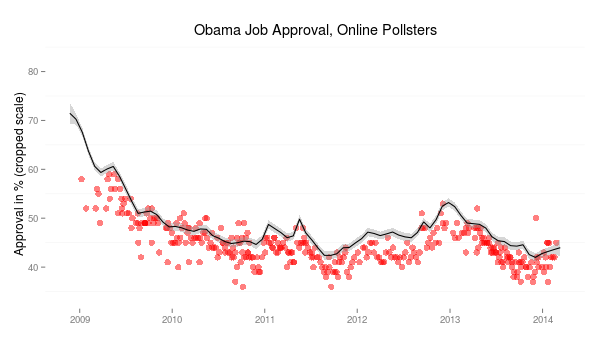
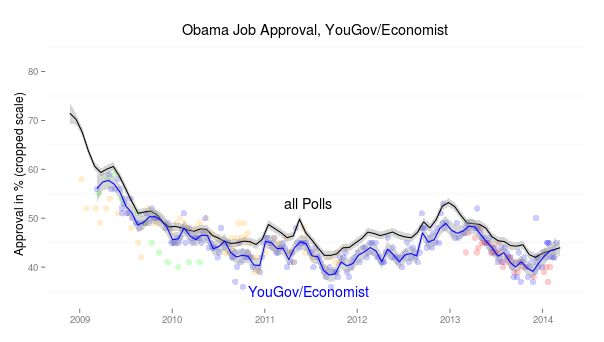
The most interesting result of the analysis of bias among pollsters is shown in the following graph, where polls conducted online are highlighted:
If we draw the same LOESS regression line with standard error, it looks like this:
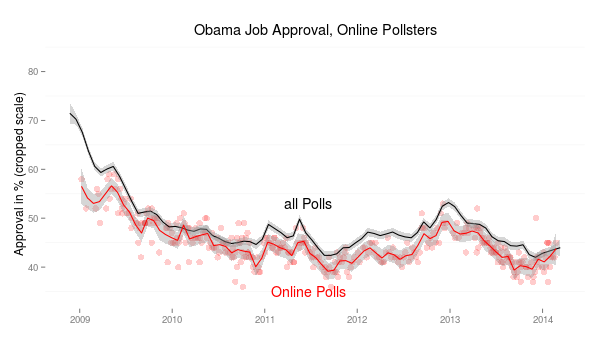
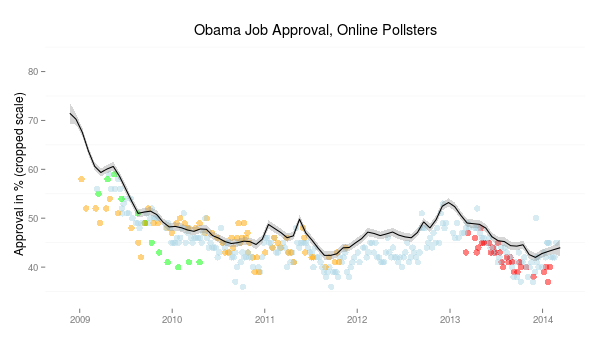
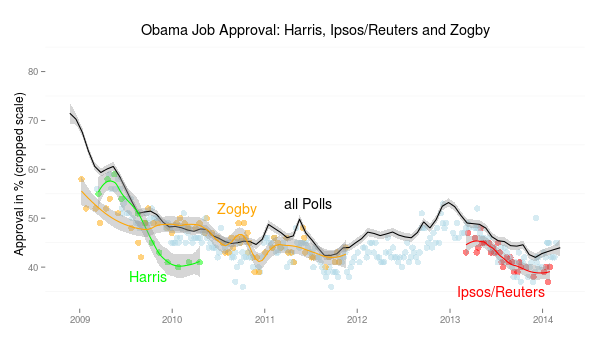
For the entire time, there is a clear visible bias: Internet polls tend to be biased against Barack Obama, on average underestimating his popularity by 3.6 percentage points. There are four pollsters that conducted systematic online polls, although just one did it for the entire time: The YouGov/Economist poll was conducted 236 times during the Obama presidency, is the main contributor to online polling data, and shows the same bias pattern as all online polls. There are 65 Zogby polls which were conducted from 2009 to 2012 and actually showed some unbiased results in 2010, while still terribly underestimating the president’s popularity most of the time. The Ipsos/Reuters poll, which has been conducted 32 times since early 2013, has also shown significant bias, again underestimating Obama’s approval. The same thing holds for the 12 online surveys conducted by Harris in 2009 and 2010, with the additional achievement of consistently producing outliers in the later polls:
But why are these results so consistently biased against Obama? Let’s look at individual pollsters: There are good pollsters and bad pollsters, Nate Silver found in 2010 that Rasmussen polls were particularly inaccurate and biased. Rasmussen reduced bias in the following years, and lately developed a bias in the other direction, which a good example of why aggregating polling data seems to be a good idea. For our case, we have the problem that one pollster is responsible for a lot of the data, but since the three other institutes get similar biases, let us assume that there is really something wrong with online polling.
This leaves us with two possible explanations: either certain segments of the population are overrepresented in online polling and no one has thought of controlling results for them, or people just answer more truthfully. While one would assume that young (speak: more democratic) people are overrepresented in Internet polling, or men (more likely to be republicans) are using online polls more, we simply can’t know what pollsters control for in their survey (and since they earn money with it, they probably won’t tell us). One would assume that at least age and gender are controlled for, but we can’t be certain.
The other explanation would be that not the Internet polls are biased, but that people who are being interviewed on the phone have a so-called „social desirability bias“, which means that they are giving answers according to what they thing is socially accepted on the phone, while illusions of anonymity actually make them answer more truthfully online. This phenomenon has been documented in several studies and in the case of Obama has a clear name: race. This phenomenon has been called the Bradley effect, named after the 1982 democratic candidate for Governor of California, Tom Bradley, an Afro-American who lead the polls before the election, but lost narrowly to his white republican opponent.
Of course there could be other reasons (for example, people might think he’s a socialist and a Muslim but feel ashamed to admit these ridiculous beliefs on the phone), but research has shown that a strong desirability effect exists regarding race. Especially when the phone interview is conducted by a real interviewer that has an ethnic slang (speak: he/she sound black) , this bias will be even stronger (see this article (PDF)).
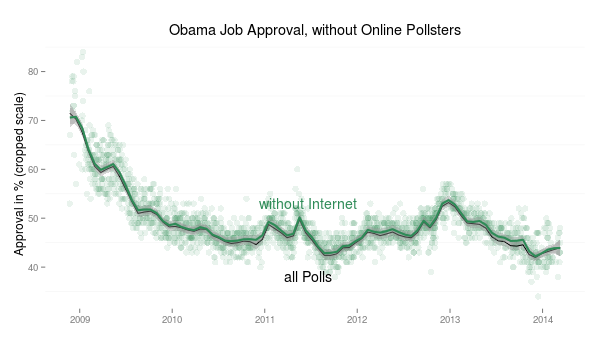
We can’t say without doubt whether the biased results in online polling come from people being more honest online or from certain segments of the population being overrepresented in the sample. In either case, Obama should not be too sad when he compares his aggregate ratings to those of his predecessors, given that they did not have to deal with online polling (apart from GW Bush maybe), we should exclude the online polls from the analysis when comparing popularity with other presidents. Although none of them had to face racial biases, other social desirability effects might have played a role, had there been online polls at the time.
But since 86% of polls are still conducted via phone, excluding online polls does not have a big effect on the average popularity rating:
For future research it would be interesting to see if a white, male successor of Obama will have the same bias in online polling, hence disproving our social acceptability theory, or if the effect disappears when race is not an issue anymore. Of course it would also be interesting to see what kind of bias a female president would produce, but there are questions time will (hopefully) answer.
—
This blogpost is part of the MA research seminar „Political Data Journalism“ at the University of Zurich, the course is taught by Prof. Dr. Fabrizio Gilardi, Dr. Michael Hermann and Dr. des. Bruno Wüest. The article was written by Nikolai Thelitz (nikolai.thelitz@uzh.ch, student nr: 09-724-626) and handed in on March 15, 2014, with a length of 1’168 words.
If you want to look at the analysis, here’s the replication archive (dataset & R-script)